
Understanding Your DEXA Results: What the Numbers Really Mean
If you’ve recently completed a DEXA scan or you’re thinking about getting one, you might be wondering what all those charts, numbers, and ratios actually mean. The breakdown below walks you through each section of your DEXA report; what it measures, why it matters, and how to interpret the results in a way that helps you take action.
This article walks through your DEXA report section by section, so keep your printed report or PDF open as you read. The example report shown is from a 27-year-old White male, but do not get hung up on the specific numbers or percentiles from the example. Use it as a guide to match each explanation to your own results.
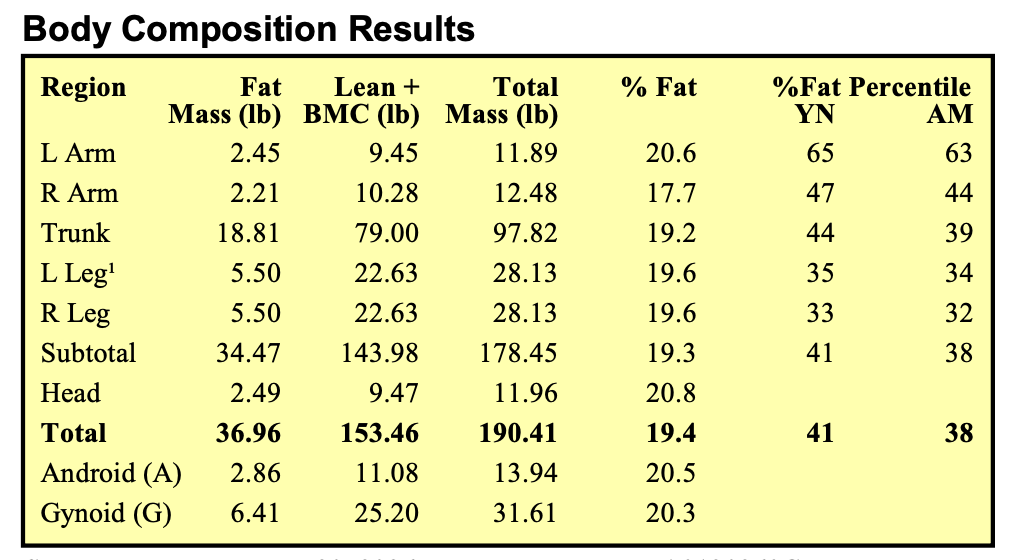
1) Body Composition Results
This part of the scan gives you a region-by-region analysis of your scan, so you can see what you’re made of and how your results compare to others. Whole-body DEXA scans divide the body into head, arms, legs, trunk, and two “pattern” regions: android (abdominal) and gynoid (hips and upper thighs). This is what makes DEXA scans so valuable: they reveal where your fat and lean mass are, not just how much you have.
For each region, the scan provides four key values:
Fat Mass
Fat mass is the amount of fat present in that region. This is important because central fat (trunk and android) is more likely to be linked to metabolic and cardiovascular risk factors than fat in the legs or gynoid regions.
Lean + BMC
Lean mass includes muscle, organs, connective tissue, and water. BMC stands for Bone Mineral Content, which is the mineral content of bone in that region. DEXA scans combine lean and bone measurements here to give you your fat-free mass, and this helps the scan distinguish between fat and lean as accurately as possible.
Total Mass
Total mass in the region is simply a sum of the tissue compartments, which helps validate the math and gives you a clear starting point for tracking.
Percent Fat
Percent fat is the percentage of the region’s total mass that is fat. This is often more useful than absolute grams because it reflects tissue quality, not just quantity.
YN vs AM percentiles
YN (Young Normal): Compares your measurements to those of healthy individuals aged 20–29
AM (Age Matched): Compare your measurements to those of individuals of the same age, sex, and ethnicity.
Source: Advanced Body Composition® Reporting and Interpretation
Percentiles indicate how you compare to others.
Example for body fat percentiles: If your AM is 38, your body fat % is higher than 38% of your peers and lower than 62% of your peers. If your AM is 72, your body fat % is higher than 72% of your peers and lower than 28% of your peers.
General rule: Lower percentiles are usually better for fat values. Higher percentiles are usually better for lean and bone values.
Why is BMI included in the report if it’s outdated?
BMI is popular because it’s quick, but it’s outdated for individual health because it only uses height and weight. It cannot tell fat vs muscle, it cannot show where you store fat, and it can miss people with a “high” BMI who have high lean mass. It also fails at tracking progress if you lose fat while gaining muscle.
We include BMI on your report because it’s a familiar reference point that many people and providers recognize. But DXA is better because it measures what BMI can’t: body fat %, lean mass, regional fat distribution, visceral fat, and bone metrics, so you get the real story behind your weight.
Source: UCSF Department of Radiology & Biomedical Imaging
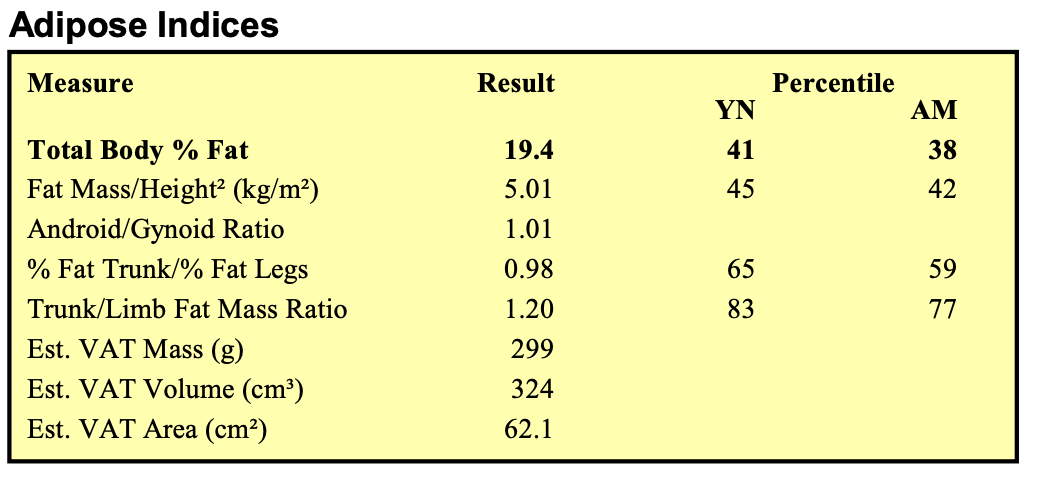
2) Adipose Indices
This area focuses on fat as a source of health risk and fat distribution, including visceral fat. It allows you to assess fat in relation to height, trunk vs. limb fat distribution, and hidden fat not measured by the scale or BMI.
Fat Mass/Height² (kg/m²)
This measures fat mass normalized for height, but it only measures fat tissue. It is a good measure for comparing individuals of different heights and for monitoring changes in fat mass over time. Lower percentiles indicate less fat for height.
Android/Gynoid Ratio
A rough guide to where your fat is distributed. Android is abdominal, gynoid is hips and thighs. The higher the ratio, the more fat is likely to be centrally distributed, which is a greater risk factor for cardiometabolic disease.
% Fat Trunk / % Fat Legs
This ratio compares trunk fat percentage to leg fat percentage. A ratio above 1.0 indicates a trunk-dominant distribution. A ratio below 1.0 indicates a leg-dominant distribution. A ratio close to 1.0 indicates equality.
Trunk/Limb Fat Mass Ratio
This ratio is similar but uses fat mass instead of percent fat. A higher ratio means more of your fat is stored in the trunk, which is often linked to higher cardiometabolic risk. A lower ratio means more fat is stored in the limbs, which is typically a lower-risk pattern. That is why two people can have the same total body fat percentage, but different risk profiles depending on where that fat is stored.
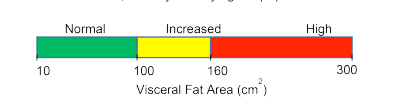
*Graph: Visceral fat thresholds associated with metabolic risk factors for coronary heart disease - Advanced Body Composition® Reporting and Interpretation
** VAT area (cm²) is the most commonly used risk-oriented metric based on the literature and clinical interpretations - Advanced Body Composition® Reporting and Interpretation
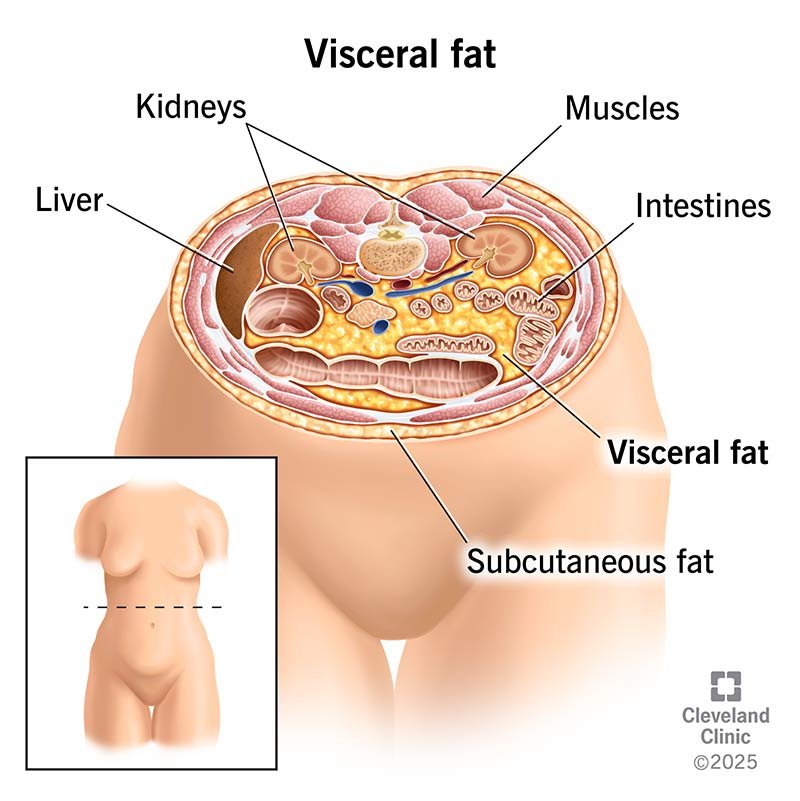
Estimated Visceral Adipose Tissue (VAT)
VAT is fat that is stored deep around your organs. DEXA calculates it as:
- VAT Mass
- VAT Volume
- VAT Area
“There is mounting evidence visceral adipose tissue (VAT) is a prognostic indicator for disease risk. Unlike subcutaneous fat whose main function is energy storage, visceral fat cells are metabolically active and impact a wide variety of clinical risk factors including fasting glucose levels, serum triglycerides, and cholesterol (1,2)...
Visceral fat is more dangerous than subcutaneous fat because visceral fat cells release proteins that contribute to inflammation, atherosclerosis, dyslipidemia, and hypertension.” - Thomas L. Kelly, Senior Principal Scientist Hologic, Inc.
The practical takeaway is that tracking VAT gives you a more direct window into metabolic risk than the scale alone. If your VAT is trending down over time, that is often a meaningful health win, even if your total weight barely changes.
YN vs AM percentiles in this table
For adipose values, percentiles tend to be similar in concept: lower percentiles indicate less fat compared to others, higher percentiles indicate more.
Example: The individual in this report is in the lowest 38% of people in their age group for body fat %. But for trunk/limb fat mass ratio, they are in the highest 77%. Indicating overall they have a healthy body fat %, but higher concentration of fat stored in their trunk compared to their peers.
3) Lean Indices
Lean indices are concerned with your lean tissue, primarily muscle. This is one of the most useful parts of the report for athletes and longevity enthusiasts, as lean mass is a strong predictor of muscle strength, metabolism, posture, and aging.
Lean Mass (Total)
Lean mass is muscle, plus organs, connective tissue, and body water. Lean mass is one of the most valuable metrics on your report for tracking muscle changes, especially when you compare it across multiple scans over time.
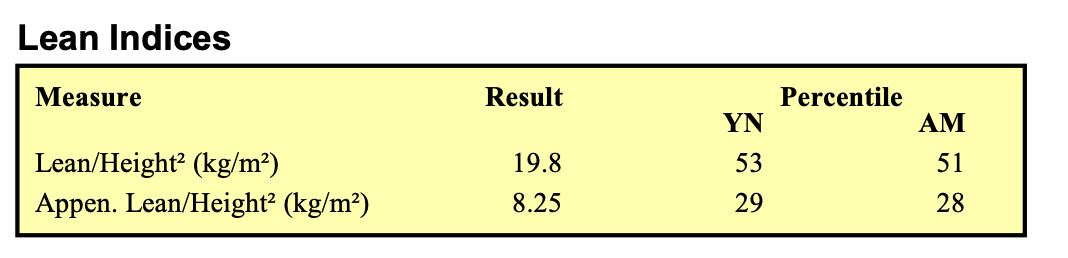
Lean Mass/Height² (kg/m²)
Also known as the Lean Mass Index. This value normalizes lean mass for height so you can compare values fairly regardless of body size. Higher values and percentiles indicate greater lean mass relative to height, and thus greater lean mass reserves for your size.
Appendicular Lean Mass (Arms + Legs)
This is lean mass in your limbs, and is highly correlated with mobility, athleticism, and muscular strength.
Appendicular Lean Mass/Height² (kg/m²)
A standardized measure to assess whether your limb muscle mass reserves are low, average, or high for your size. Higher percentiles indicate greater muscle mass relative to height.
Why lean percentiles are different from fat percentiles
When it comes to lean values, higher percentiles are usually better. The best kind of recomposition is when your fat percentiles move lower and your lean percentiles remain stable or move higher.
In this example, the person is slightly above average for lean mass/height, meaning they have more lean mass than 51% of their age-matched peers. But for appendicular lean mass/height, they’re below average, with more limb lean mass than only 28% of their peers.
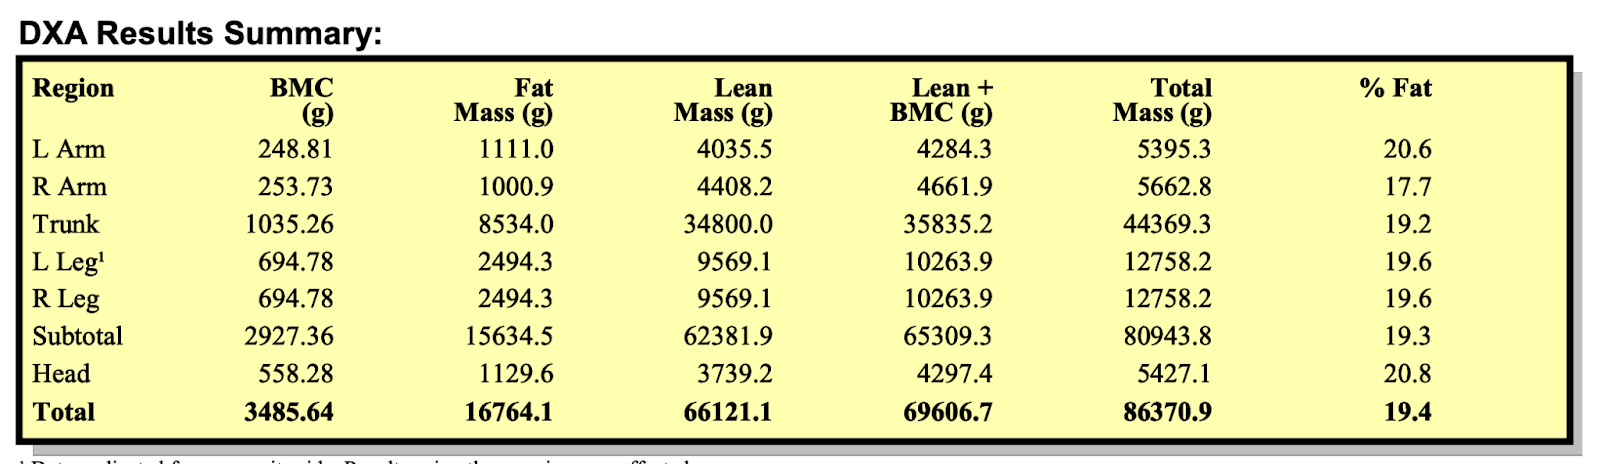
4) DXA Results Summary
This is the “math table” of your scan. It breaks down how DEXA assigned bone, fat, and lean mass to each region, and then summed all of these values together.
- BMC: Bone mineral content in that region (mostly calcium and phosphorus). BMC is not bone density. Bone density is BMD (g/cm²), which is BMC divided by the bone area measured.
- Fat Mass: fat tissue in that area.
- Lean Mass: non-fat, non-bone tissue in that area.
- Lean + BMC: fat-free tissue (lean plus bone mineral).
- Total Mass: fat mass plus lean plus bone mineral.
- Percent Fat: fat mass divided by total mass in that area.
How to use it
- Compare left to right for symmetry.
- Follow trunk fat and percent fat in trunk over time for metabolic changes.
- Use subtotal and total values consistently when comparing scans.
Unit tip: If mass is measured in grams and you prefer pounds: grams ÷ 454 = pounds.
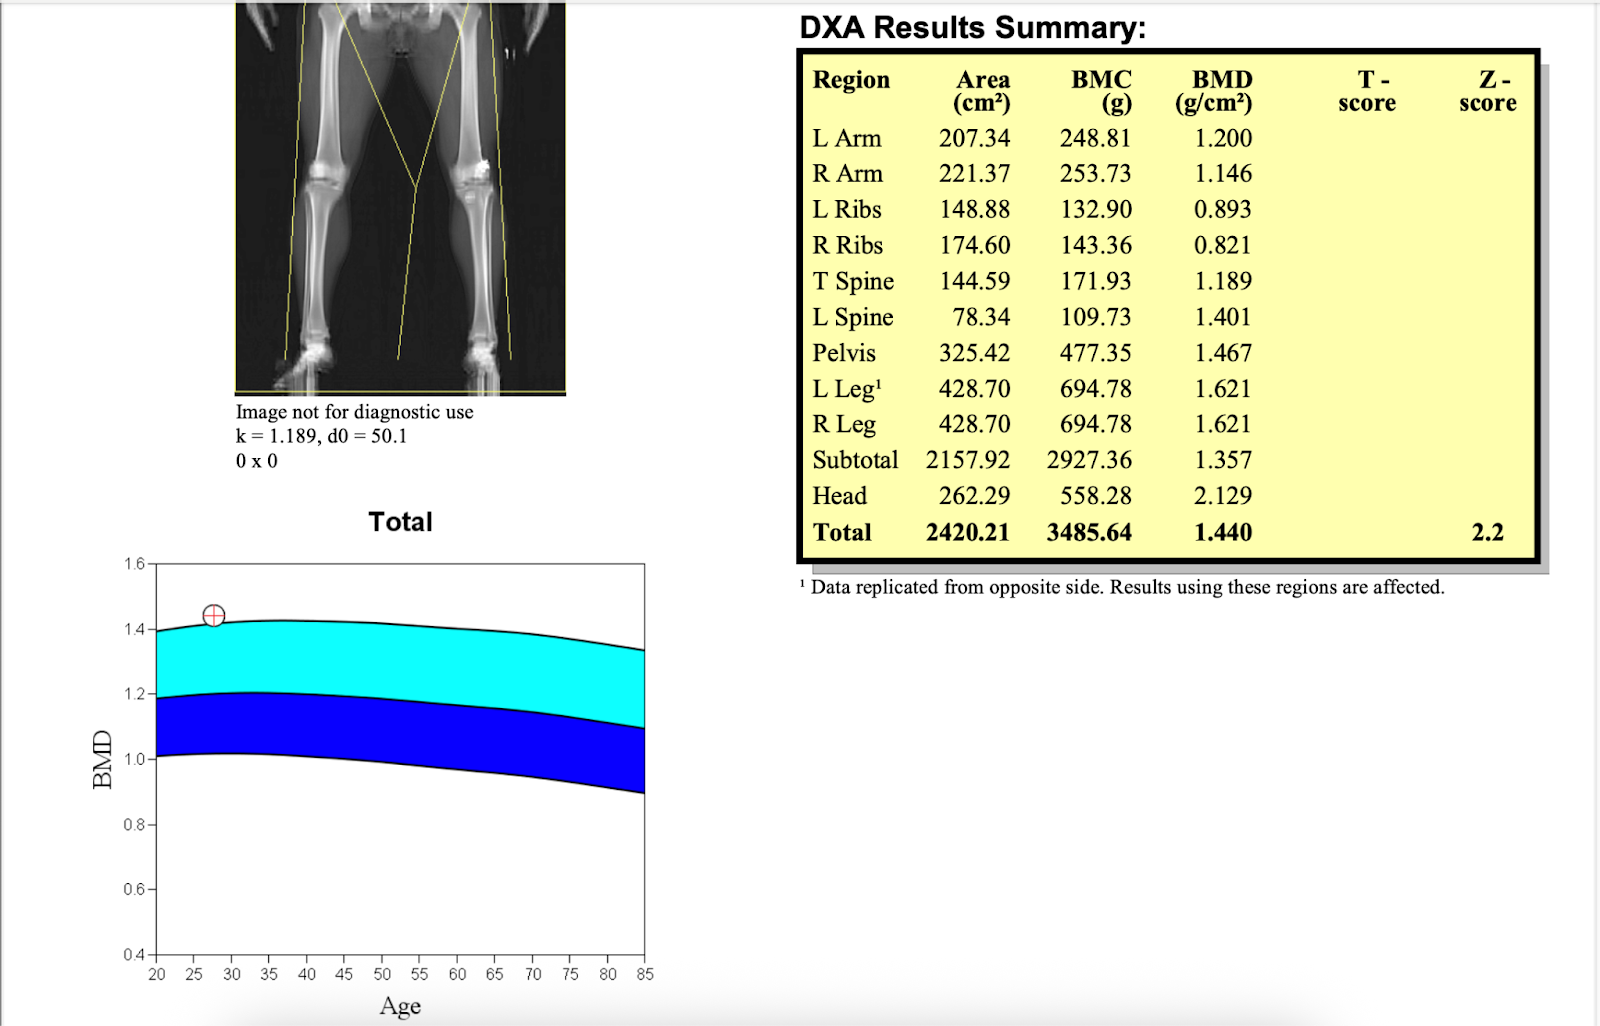
5) DXA Results Summary: Bone Density section (BMD, T-score, Z-score)
Bone density may be found in whole-body composition scans, but are not used for diagnostic purposes. Knowing your bone density baseline and the osteoporosis and osteopenia benchmarks can help you decide whether to pursue a diagnostic DXA scan or talk with your physician.
BMD (g/cm²)
Bone mineral density is a measure of the amount of mineral present in a unit area of bone. The higher the bone mineral density, the greater the bone strength and the lower the risk of fractures.
Area and BMC
- Area (cm²) is the measured bone area.
- BMC (g) is the total bone mineral content.
- BMD is calculated by dividing BMC by area, and it is the most important value used for interpretation.
T-score (For individuals over 50)
This score compares your bone density to that of a healthy young adult at the peak of bone mass.
- -1.0 or higher: Normal
- -1.0 to -2.5: Osteopenia
- -2.5 or lower: Osteoporosis
The closer to zero or positive, the better.
Source: Johns Hopkins Medicine
Z-score (For individuals under 50)
This score compares your bone density to that of people of your age, sex, and ethnic background. A Z-score of -2.0 or lower is often an indication to investigate why your bone density may be lower than expected.
Source: National Institute of Arthritis and Musculoskeletal and Skin Diseases
Why some areas have blank T or Z scores
Whole-body scans may provide a general measure of BMD, but T and Z scoring is most reliable at specific sites such as the hip and spine. The T-score is blank here because this person is not over 50. If this person was over 50 he would have both a T-score and Z-score on his report.
Frequently Asked Questions
How often should I repeat a DEXA scan?
For non-diagnostic body-composition tracking, many clients find value in scans every 1–3 months to monitor progress in fat loss or muscle gain, thanks to DEXA’s high precision and very low radiation dose.
How do I lower Visceral Fat?
Stay active, cut ultra-processed foods, and manage what you eat. If you want a more in depth view into Visceral Fat you can check out our article here.